
How To Prioritize Features That Get Customers To Buy: Understanding What Influences Willingness To…
Celestia Howe
How To Prioritize Features That Get Customers To Buy: Understanding What Influences Willingness To Pay
In the battle to win customer’s hearts and minds, marketers often develop a go-to-market strategy based on the five P’s of marketing; product strategy, price strategy, promotion, placement, and people (some will use similar variations, but the concept holds).
While a great pricing strategy is built around balancing revenue, retention, and growth, companies often overlook a crucial aspect of developing pricing tiers and feature roadmaps: understanding which feature sets the market is willing to pay for.
Often, customer discoveries and market research processes reveal which features customers value and what competitive alternatives charge in the market, but not how the bundling of features into tiers drives optimal value while mitigating the friction of confusing pricing tiers, or freemium trap of not segmenting by the value each buyer persona perceives.
Willingness to Pay
Willingness to pay (WTP) is the highest price a customer is willing to pay for products and services in a particular context. For instance, a consumer will pay more for water and soda from a mini bar in a hotel than in a supermarket. A young business executive may elect to pay more for an airline seat when traveling for business than traveling for pleasure, especially if their ticket is paid for by the company. The placement and positioning of a product anchor the value in a customer’s mind.
As intuitive as this sounds, most product pricing strategies aren’t developed methodically from the customers’ point of view. More often, they’re laden with assumptions that the internal team holds, and weakly validated.
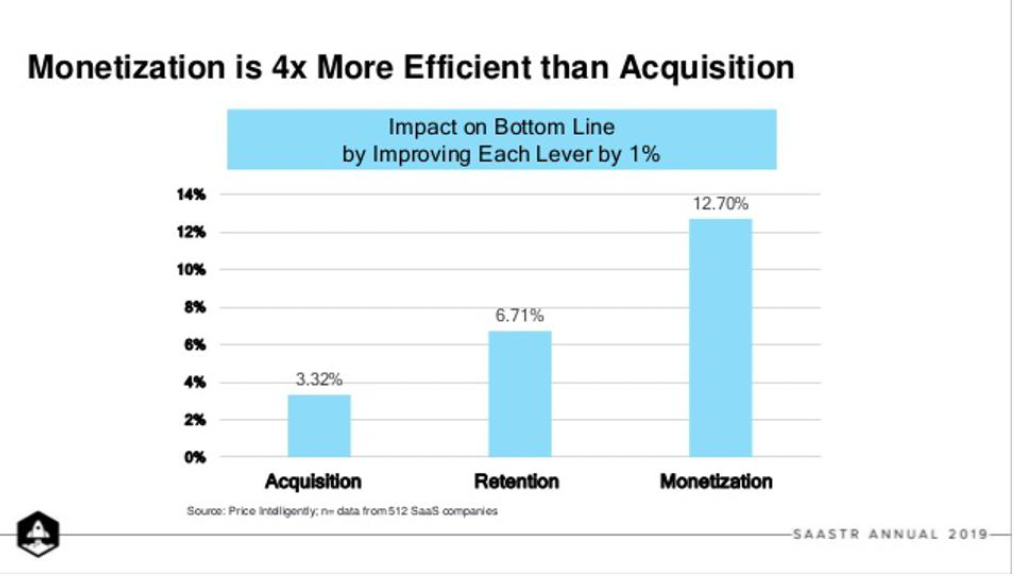
Even worse, pricing and monetization strategy often receive the least attention from marketers, while acquisition and retention efforts get the lion’s share of resources and focus. Paradoxically, they have the exact reverse impact on long-term revenue generation and sustainability: a 1% optimization in a company’s monetization strategy yields higher returns than the same % optimization of both acquisition strategy and retention combined.
Without an effective pricing strategy that quantifies customers’ willingness to pay:
- acquisition strategies will see diminishing returns, as we saturate acquisition channels and customer acquisition costs rise over time
- the lagging indicator of account and net-dollar retention metrics are likely to be misattributed to ineffective customer success or product satisfaction, even if the problem was acquiring customers who are not target buyers, and not in a position to see and deliver the appropriate value from our products
We can think of this simple equation:
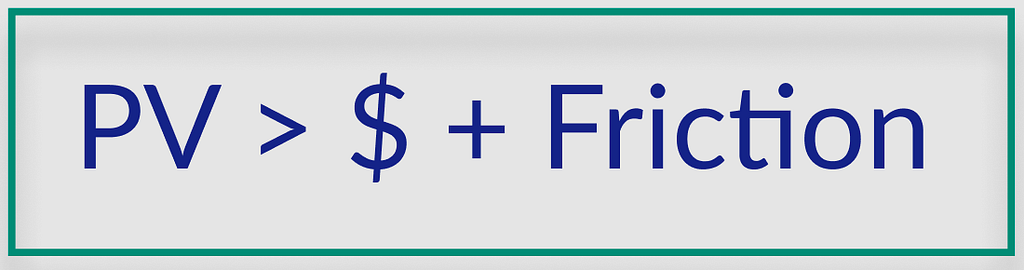
Customers will transact with us if their Perceived Value is greater than the Price Plus the Friction of transacting (which could include confusion over which plan is right for them, lack of internal buy-in, perceived risk of a failed rollout and implementation, or lack of connection between the product’s value and their unique business objectives).
An effective pricing strategy will always quantify the customers’ perceived products’ value, and the friction it takes to acquire it.
Understanding End Users vs. Decision makers
It’s entirely possible that a company would be better off using your tool, but the decision maker doesn’t have annual or quarterly goals aligned with the benefits you’re currently promising, so it’s not worth it to them to invest time or resources into rolling it out. This is why getting the positioning and feature set aligned to the priorities and perceived value of your customers is so important.
Don’t forget the role that internal buy-in among end users plays. Even if your decision maker is bought in, the risk and friction they may face internally from other end users is often enough to stall a deal or prevent renewal.
Keep this in mind:
- Buyers are instrumental in the acquisition of new customers.
- End users are instrumental in customer adoption and renewal.
- If a buyer chooses to invest in your product, but the end users never adopt it with fidelity, they’re unlikely to renew it.
As mentioned above, renewals and retention drive more revenue gains long-term than Net New Account acquisition, so don’t force marginal deals to close, and bear in mind how much the onboarding process will require from end users. Whenever I hear a company mention that their product is great because, “Now customers don’t need to use Excel!” I know we have a formidable incumbent that will take work to unseat. Quantifying the aggregate willingness to pay is essential for optimizing conversion rates.
Overcoming Free Competitors’ Perceived Value
I’m surprised how often I hear founders proudly announce that “customers no longer need to rely on clunky tools like email and spreadsheets” to capture the core value that their products promise, as if this were inherently a value to customers who already have these tools integrated into their workflows.
Competing with products that are free or already well-integrated into your customers’ workflows, like Excel and Gmail, can be difficult alternatives to challenge when selling a product. Many times customers default to tools that they are familiar with versus tools they are highly satisfied with, adding to their friction and switching cost. It’s challenging for new entrants to gain adoption over status quo products.
Free products, or low-cost alternatives that companies already need and know how to use, can be the hardest to unseat. Excel, Google Docs, or anything that your customers already use throughout the organization can incur substantial internal adoption friction to train, onboard, and rollout across the organization. This is especially true in B2B settings, where buyers, end users, and budget allocators (like a Chief Financial Officer) may have entirely different priorities.
Categorization
The category you position and describe your product in impacts willingness to pay as much as the product value itself. There is no shortage of accurate ways to describe any product, so be mindful of the analogies and comparisons you draw. “Like water, but flavored and carbonated,” anchors your product against low-cost alternatives. Compare this example to “Like artisan craft beer, but non-alcoholic” for the same product which positions you in a premium category. These examples showcase how perceptions of a products’ value and use changes significantly depending on category positioning.
Because willingness to pay varies based on a number of factors, one of the best ways to prioritize the product features customers value is to conduct a Maximum Differential Scaling (MaxDiff) analysis. Conducting a MaxDiff analysis is one of the best tools to find out what individual customers value and to assess their WTP.
Considerations to make before conducting a Conjoint or MaxDiff Analysis
This largely misunderstood marketing survey could be the answer to growing your sales and increasing revenue. Learn how MaxDiff makes a difference to your marketing efforts by asking your customers what matters to them most and what they are willing to pay for your products and services.
What is a MaxDiff Analysis?
A MaxDiff analysis is a quantitative research method used by marketers to rank different items which typically starts with a MaxDiff survey. It’s also known as a type of best-worst scenario scaling used to gauge survey respondent’s preference scores. Simplistically, it involves survey takers indicating what their ‘Best’ and ‘Worst’ options are out of a given set of items.
Invented by Professor Jordan Louviere in 1987, a MaxDiff survey repeatedly asks participants to indicate the best and worst item from a subset of items. It’s a statistical relative of conjoint analysis and derives its name from “maximum difference” scaling. It’s often preferred by marketing and product teams because it’s easier to create and interpret than the full real-world scenario modeling required by a Conjoint Analysis, while still revealing comprehensive information.
MaxDiff is used to rank:
- Features of a product by its importance.
- Frequency of use.
- Customer satisfaction levels against various aspects of a brand.
- Flavors of a product by consumer preference.
After analysis, MaxDiff outputs a ranking between the tested items plus records a metric distance between the items.
MaxDiff Surveys: Benefits and Limitations
As with any research methodology, there are benefits and limitations to using MaxDiff surveys to provide marketers with a product roadmap. In many cases, feature surveys fail to take into account cultural differences. The product survey can become boring for the respondents, and at times more significant discrimination among items is required than the simple use of scales.
More importantly though: a Max Diff survey will tell you the features that customers value the most but it won’t necessarily tell you the ones that they’re willing to pay for.
As an example, Lyft users may value in-app traffic updates used to calculate their commute time, but they’re not willing to pay more for a ride because of it. Virgin Airlines passengers value hot hand towels, but won’t pay more for their flight because of them. Allowing max diff and customer satisfaction surveys alone to define NPS is a weak indicator of retention, but each product has key behaviors that inform customer values.
On the flip side, more items can be included with MaxDiff surveys than with regular rankings. It allows marketers to screen among brands, product features, image statements, and advertising claims. MaxDiff analysis enables marketers to test many items, eliminate scaling bias, recover precise ratio data, and measure customer satisfaction.
Where MaxDiff surveys come into their own is to assist effective product marketers in prioritizing features from the perspective of the customer, and in particular WTP. Discovering what is most important in a smartphone for instance, marketers can conduct a feature survey to uncover which of the following features is most or least important; price, brand, operating system, 5G support, pop up self-camera, or quad-camera system. This data analysis allows marketers to prioritize features promoted in marketing campaigns that tempt customers to pay.
Designing MaxDiff or Conjoint Surveys to Prioritize Features
Taking a MaxDiff or Conjoint approach to constructing survey questions forces respondents to rank the relative importance of brands, ideas, or services, when presented like the alternatives they are seen as by customers in the real world.
A survey question shows the respondent a set of items and asks them to choose what is most and least important to them. When the results for a particular question is displayed, the respondent will select the ‘best and worst’ label you’ve applied to the question.
For example, one item may have one of the following best and worst labels:
- Most liked, or least liked
- Most important or least important
- Most likely or least likely
- Most appealing or least appealing
This methodology forces respondents to pick the most or least attribute, which ultimately gives you insights into what your customers truly value paving the way to a “what they are willing to pay” analysis.
To ensure you keep your respondent focused throughout the survey, it’s best to keep attributes to five or less. However, the more sets you show on a survey, the more individual features that can be compared with others.
Prioritizing Feature Requests
As part of the product development process, product marketers will need to prioritize feature requests (FRs). An FR may come from an executive, the marketing team, or even a customer. Instead of subjective judgement or guessing, a MaxDiff survey helps marketers prioritize FRs relative to their importance and required effort. Based on survey results, marketers can also define which features are valued to inform customer willingness to pay and optimal pricing strategy.
Acting on the Data
Once you have conducted a MaxDiff survey, a MaxDiff analysis will give you a view of customer preferences in a ranked, prioritized list. The report highlights the differentiation between features giving you a greater understanding of preference gaps and it provides a cluster analysis that uncovers customers with similar preferences and priorities.
From this analysis, pair qualitative interviews to understand patterns in why people prioritized the features that they did, including how much they expect them to cost or if they’d be willing to pay more based on the addition of specific features. This can help inform which features are table stakes — expected in the market based on the categorization you’ve chosen — and which are true value-driving differentiators.
A Van Westendorp analysis can help you further understand perceived value based on products with the prioritized feature sets, and how different segments may perceive the relative value.
How To Prioritize Features That Get Customers To Buy: Understanding What Influences Willingness To… was originally published in Strategica Partners on Medium, where people are continuing the conversation by highlighting and responding to this story.